|
|
|
|
|
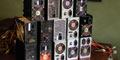
Thirteen PSU Roundup |
|
Join the community - in the OCAU Forums!
|
Performance Comparison
Performance Comparison:
A common measure of PSU quality is how much variance is observed on the various voltage rails under load. Some variance is a normal part of how the PSU works, but too wide a variance and your system can produce errors which can make it unstable, or in extreme cases can even be damaged. To test this, we used our long-term testbed, a Prescott P4 3.2GHz with Radeon 9800 Pro video card. We tested with the CPU overclocked to 3.6GHz and 1.58v core voltage, with the Radeon overclocked to 400MHz core and 365MHz memory. Our system also contained three 7200rpm hard drives (40GB and two 200GB), a DVD-ROM drive, 108MBit wireless network card and two 120mm fans.
For each test, the machine was booted from cold, two instances of Folding@Home were loaded, the video card was set to the overclocked settings with the excellent ATITool and 3DMark2005 was run twice. Voltages were monitored during the entire process on the motherboard with MBM 5. We also monitored each 3DMark2005 run with a multimeter on a spare Molex connector (on the same cable as the video card), watching the +5v line on the first 3DMark2005 run and the +12v on the second.
The table above is from page 12 of the ATX 2.01 PSU Design Guide PDF. The 1.3 spec PDF has a very similar table on page 10, with the only difference being that ATX 2.0 allows for an additional +12v rail (with the same tolerances as the existing one.) So these are the design requirements for all the PSU's here - indeed, ALL ATX PSU's. BTW, those PDFs are from formfactors.org, a very handy reference site.
My Excel skills have deserted me - I was unable to make a graph that successfully showed the readings and the variance between them. So, here's the plain table, with some highlighted results. First, the multimeter readings:
The only result that strays beyond the spec is the Super Flower, which sagged down to 11.12v on the +12v line. This is outside the 5% allowed, but the spec does note that under full load the allowed variance is 10%, so maybe it's excusable. None of the other units came even close to being that low, though. I highlighted the TrueControl results in green because they had the least variance, only a .01 volt change on both rails during the entire test.
Now for the MBM readings from the motherboard. Bear in mind that ABIT motherboards have a reputation for under-reporting voltages and this one seems to be no exception:
Again the Super Flower shows a sag, with the "Yum Cha" generic unit following it down. Quite a few units dropped by nearly half a volt on the +12v line, but this is within the spec. The Yum Cha also reported the only abnormal vCore reading, hitting 1.58 at one point. Presumably the motherboard's voltage regulation circuitry dealt with all other spikes, but was defeated by that one. Note that we didn't report readings for the -5v line because it has been removed from the standard, and -12v because all readings were spurious (-8.24 to -8.57) so I assume this motherboard doesn't use/report it.
These results are interesting, but not particularly meaningful for enthusiasts. What we really want to know is what effect this will have on our systems using these PSUs. We'll try to get some real-world results now.
One quick word about the graphs below - I know that graphs with axes starting from anywhere other than 0 are frowned upon, and we avoid them as a general rule. However, the differences we're seeing between these units are too small to see on zero-origin graph. Yes, I know that's exactly why you use a zero-origin graph, to avoid making something look more significant than it really is, but the point is we're never going to see, say, 5v from the 12v line. So in our graphs below we have primarily used a zero-origin axis, but also included a "zoomed" section to highlight the differences a bit better. If this offends your scientific sensibilities, then don't look at the zoomed part. :) I should also note that there's a huge number of tests and system rebuilds involved with the results below. For each individual test I may have run the testing over several days or nights, but I made sure the ambient temperature was pretty much constant as testing was conducted (usually late at night) and did several random re-tests as "sanity checks" to make sure our results were repeatable.
So, firstly, let's see at what CPU speed each PSU lets our Prescott system boot. The test was simple: boot cleanly into Windows 2000, load the desktop successfully, open Internet Explorer and load our homepage, then shutdown and cleanly reboot back into the BIOS setup. This last section is crucial, as we often found the system would boot cleanly and shutdown ok, but when rebooting it would come up with a CMOS checksum failure. This is easily remedied by using the CMOS clear jumper on our motherboard and would count as a fail for the purposes of our testing. This is of course only a basic test of stability but it will set the ball-park for the limits of our system.
Next up, video card overclocking. Some quick experimentation revealed that the GPU core speed only varied one or two MHz from PSU to PSU, so testing was conducted with the core set at 420MHz and the focus on memory speed. The video card's memory was pushed as high as possible with each PSU. After the video card was warmed up with the first two sections of 3DMark2005, each MHz increment was tested for 15 seconds with ATITool. Any reported errors resulted in a fail and the next lower speed was tested.
This gives us some spread of results, but again it's not very dramatic. On the next page, we'll make the system work a bit harder, using 3DMark2005 and Prime95.
|
|
Advertisement:
All original content copyright James Rolfe.
All rights reserved. No reproduction allowed without written permission.
Interested in advertising on OCAU? Contact us for info.
|

|