|
|
Advertisement:
|
|
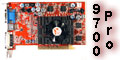
ATI Radeon 9700 Pro Video Card |
|
Join the community - in the OCAU Forums!
|
Performance Comparison
Performance Comparison
Remember, we're using 2 testbeds. A KT333 testbed (1.4GHz AthlonXP 1600+) and an SiS648 testbed (2.66GHz Pentium IV).
3DMark2001 SE (Build 330)
3DMark2001SE from MadOnion is still the standard DirectX benchmark. We used the latest "build 330" version and ran it at 3 resolutions:
This graph is a little hard to understand at first, I know. Bear in mind that the yellow bars are the 2 cards on the SiS648 testbed and the blue bars are on the KT333 testbed. So, you should compare yellow to yellow and blue to blue in the same resolution. The darker bars are the R9700 and the lighter bars are the Ti4600.
On both testbeds, at all resolutions, the R9700 is considerably quicker than the Ti4600. As the resolution rises the R9700 increases its lead. Interestingly, on the considerably slower KT333 testbed, in high resolutions, the R9700 manages to be quicker than the Ti4600 on the faster SiS648 testbed - over 600 3DMarks faster at 1280x1024x32, even though both cards are running at AGP4X in those configurations.
Quake 3 Arena
id Software's Quake3Arena (using our in-house Slayer demo) is a more "real world" benchmark, and used to test OpenGL. Defaults were used for the Fastest and 800x600 High Quality tests, but for the 1280x1024 and 1600x1200 tests High Quality was selected, then the Geometric Detail was set to High and the Texture Detail slider was dragged all the way to the right.
Remember, compare blue to blue and yellow to yellow in each resolution. At lower resolutions on both testbeds the cards are very evenly matched and seem to be capable of handling all that the CPU can throw at them. As the resolution - and more importantly, the texture and geometric detail - rises, the R9700 streaks ahead of the Ti4600 on both testbeds. At 1600x1200, each card scores about the same on both testbeds - which indicates to me that they have become the bottleneck on both systems. Note that the R9700 is putting out nearly 40% more frames than the Ti4600 when both are maxed out like this.
On the next page, we use the Unreal Tournament 2003 Demo benchmark..
|
|
Advertisement:
All original content copyright James Rolfe.
All rights reserved. No reproduction allowed without written permission.
Interested in advertising on OCAU? Contact us for info.
|

|