|
|
Advertisement:
|
|
CoolerMaster AquaGate Liquid Cooling System |
|
Join the community - in the OCAU Forums!
|
Performance
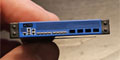
The AquaGates Liquid Cooling Unit was mounted externally, on the top of the Antec SLK3700-BQE Black Quiet Super Mid Tower Case. CoolerMaster provide 4 rubber feet that can be attatched to the LCU in this situation.
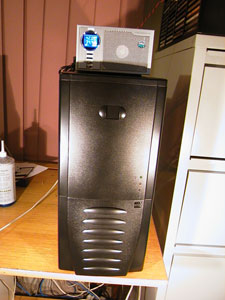
Also in this PC we have an Antec TruePower 380W PSU, ABIT NF7-S v2.0 motherboard, ATI Radeon and IBM 40GB drives. The CPU used for this test is an AthlonXP 2400+ (2GHz), selected because when overclocked it gets nice and toasty so should provide for a good range of results.
Motherboard Monitor 5.3.6.0 was used to record the System and CPU temperatures, external probes were used to measure the ambient temperature and the internal case temperature. The case temperature was measured by attaching the probe to the PSU-crossbar in the top section of the case. I wanted to check the internal temperatures when the LCU was mounted internally and externally (and also see if there was any performance difference) and also see how they were compared to the comparison HSF.
We used a Spire FalconRock II HSF as the comparison air cooler. This isn't the latest and greatest in socketA CPU cooling, but when coupled with a decent fan like the Sunon 80mm we're using, it's still respected as an above average aftermarket cooler. All tests were run with an ambient temperature of 20 deg C (+ or - 0.5 deg). Each test allowed ample time for the temperatures to stabilise before they were recorded. Idle temperatures were recorded, and then the CPU was loaded by running Folding @ Home to maximise the CPU workload.
Performance Comparisons, Stock:
2.0GHz, 1.65V: FalconRock II, AquaGate Fan Speed 1, AquaGate Fan Speed 2, AquaGate Fan Speed 3.
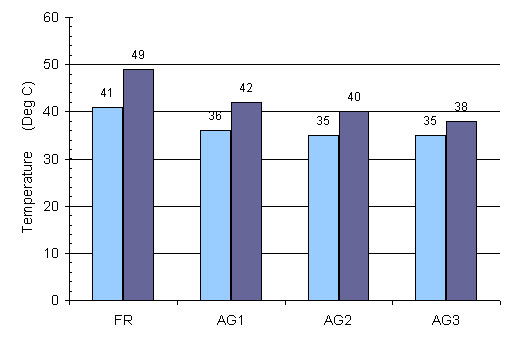
Light-blue bars represent idle temps and dark-blue are load temps.
The first set of tests was run with the CPU at stock configuration: 2.0GHz and 1.65V. Even at the low Fan Speed the AquaGate shows a fairly good performance increase over the FalconRock, and at the highest Fan Speed the AquaGate performs significantly better.
2.0GHz, 1.65V: Temperature changes over time.
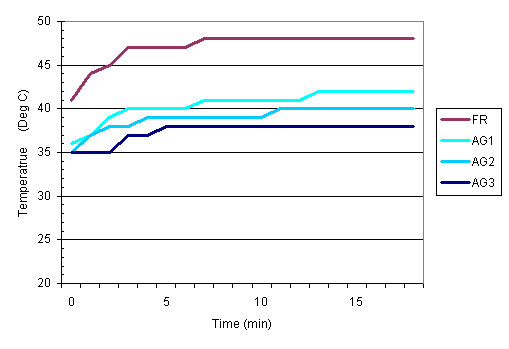
Temperature changes graphed over a 20 min period after loading the CPU.
Given that the AquaGate has a mass of liquid, filling the waterblock, pipes, radiator and reservoir, I was interested to see if it was slower to increase in temperature over time when compared to the usual hunk of copper or aluminium that is a normal HSF. The graph above shows the change in temperature over the 20 minute interval after loading the CPU.
The AquaGates LCD screen also provided two additional temperature readouts. While these are not included in our graphed results because there is no way to directly compare the data to that of the FalconRock they are interesting to note. The thermal probe placed under the waterblock and adjacent to the CPU core constantly indicated temperatures about 5 to 6 degrees less than that registered by MBM.
As would be expected, the water temperature was directly related to the CPU temperature no matter how the CPU temperature was measured. In each of the three tests, the water temperature was consistently 12 degrees less than the CPU temperature, as recorded by MBM. When the CPU was loaded, each fan speed setting cooled the water temperature and hence the CPU by 2 degrees per setting.
One of the reasons we selected this CPU was the fact that it is known to overclock fairly well, and it also allows for a nice voltage increase. To reach the 2.312GHz mark, the FSB and multiplier were adjusted to determine the maximum overclock that the CPU would allow. While the system would POST and load Windows at higher speeds, 136x17 was the best, stable speed we could achieve with the Spire FalconRock II. While better performance would be expected if we had used higher FSB speeds those up around 200 we were interested in stressing the CPU and finding the highest speed we could clock it at, rather than squeezing the best performance out of the system as a whole.
Performance Comparisons, Overclocked:
2.312GHz, 1.85V: FalconRock II, AquaGate Fan Speed 1, AquaGate Fan Speed 2, AquaGate Fan Speed 3.
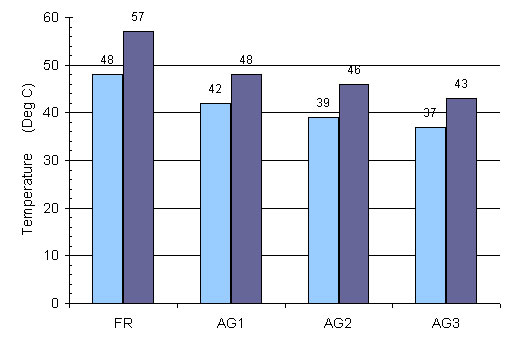
Light-blue bars represent idle temps and dark-blue are load temps.
In this configuration you can see the FalconRock II start to struggle, especially under load. Again the AquaGate shows a good performance increase, especially at the highest Fan Speed. Each of the AquaGates Fan Speed settings also shows a direct result on its cooling ability, both at idle and under load.
2.312GHz, 1.85V: Temperature changes over time.
Temperature changes graphed over a 20 min period after loading the CPU.
Again we note that in general the AquaGate reaches its maximum temperature more slowly than the FalconRock II.
|
|
Advertisement:
All original content copyright James Rolfe.
All rights reserved. No reproduction allowed without written permission.
Interested in advertising on OCAU? Contact us for info.
|

|