|
|
Advertisement:
|
|
Asetek VapoChill Mk2 Premium Edition |
|
Join the community - in the OCAU Forums!
|
Performance Comparison
Performance Comparison
I wanted to compare the performance of this system at a few different speeds. Firstly, we of course have the system running at 2.0GHz. Then, the maximum stable air-cooled speed of 2.66GHz. As discussed on the previous page I have also included the "unstable" air-cooled speed of 2.79GHz because I think with a better aircooler the system would be stable at close to that speed.
The third configuration warrants an explanation - I've also tested the system at the same speed, 2.79GHz, in the VapoChill. VapoChill make this claim on page 14 of the System Manual: An issue not often realised is that a CPU at low temperatures not only will be able to run at higher clock frequencies. It will also have an increased performance comapred to an identical CPU running at the same frequency, but where heat is removed with traditional passive cooling. Hmm. That sounds to me like someone getting carried away in the theoretical, but it's a claim we can easily test. Hence we have performance figures for 2.79GHz both when aircooled and when VapoChilled.
The last set of benchmark figures are of course from the maximum stable speed we achieved with the VapoChill - 2.99GHz. In all configurations, the memory was set to FSB:MEM of 3:4 and CAS2 with DIMM voltage set to 2.7v in the BIOS.
SiSoft Sandra 2003
We'll start with the newest version of the long-time favourite, SiSoft Sandra 2003.
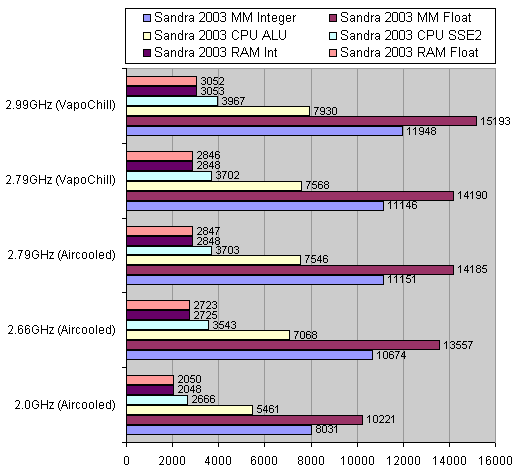
Speed scales pretty linearly here, as you'd expect. Note that there's no statistically-significant difference in the scores at 2.79GHz with different cooling methods. The multimedia benchmark shows a 48% improvement over stock speed, but only 7% of our not-quite-stable aircooled speed (2.79GHz). Compared to our stable speed with the stock aircooler (2.66GHz) we see about a 12% improvement.
3DMark2001SE Build 330
MadOnion's 3DMark is still the standard DirectX benchmark and useful for comparing game performance.
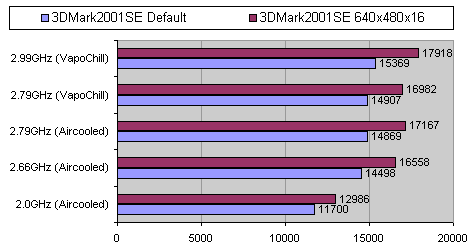
Cracking 15k 3DMarks is impressive for an old 2GHz CPU! Again we see a linear improvement in scores as CPU speed ramps up - the Radeon 9700 Pro isn't taxed by our CPU, even at 3GHz.
Quake III
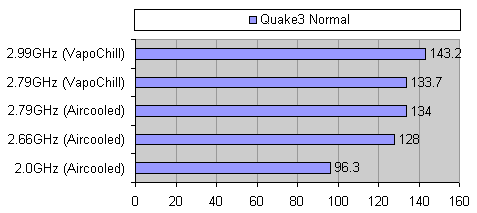
id Software's Quake3Arena (using our in-house Slayer demo) is a more "real world" benchmark, and used to test OpenGL. Because we're only testing CPU speed, settings were left at default and the benchmark was only run in "Normal" mode.
POV-ray:
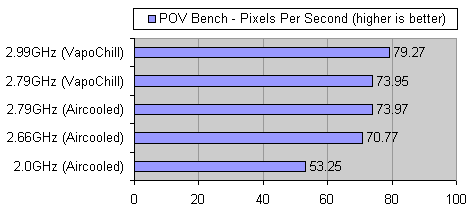
To quote their website: The Persistence of Vision Raytracer is a high-quality, totally free tool for creating stunning three-dimensional graphics. We used the "POV-Ray 3.5 standard benchmark v1.02", which raytraces a large image. The writers estimate this to take 45 minutes on a Pentium4 2GHz. This benchmark focuses purely on the sheer mathematical "grunt" of a system, including cache and memory access.
This first graph shows how many pixels per second the system was able to output at various speeds:
This second graph shows how many seconds of CPU time the system took to run the benchmark - so lower is better:
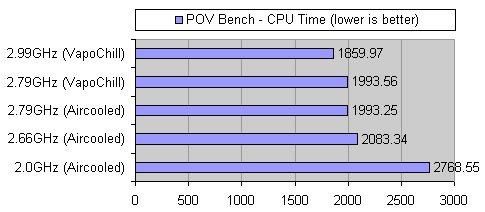
Note the 908-second difference between 2.0GHz and 2.99GHz - that's 15 minutes, dropping to 31 minutes from 46! That is exactly the kind of thing that means real money to graphics developers, mathematical modelers and other companies for whom computational time is their greatest resource. If you project that out to a rendering job that normally takes 2 weeks to run, you would save 3.5 DAYS of processing time.
Ziff-Davis Business Winstone 2002
This benchmark from Ziff-Davis is a complex one that is available only on CD. The reason why is it's large, using real applications to simulate a real user's use of a system in applications like FrontPage, MS Office and WinZip. Various tasks are performed, each benchmark is run 4 times and the system is defragged between runs. After all that, you get a simple number summarising the performance of your system during each run. We recorded the best score at each speed.
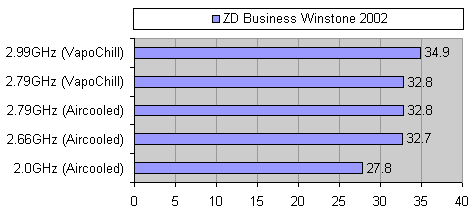
Again, we see the score linearly advance. There's actually a slightly larger jump for the 2.99GHz system than I expected.
|
|
Advertisement:
All original content copyright James Rolfe.
All rights reserved. No reproduction allowed without written permission.
Interested in advertising on OCAU? Contact us for info.
|

|


