|
|
|
|
|
Intel 925XE Chipset and 3.46GHz Extreme Edition CPU |
|
Join the community - in the OCAU Forums!
|
Productivity and Gaming Benchmarks
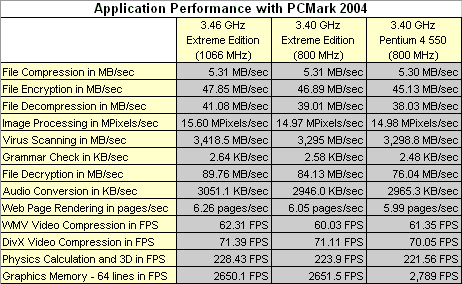
Is the substantial bandwidth gain with the 3.46 GHz EE system translating into real world performance? To answer this question we first have a look at productivity benchmarks. For this purpose we used the PCMark 2004 “System Test Suite”. It runs portions of productivity, internet, entertainment and general usage applications. In total 13 tests are included. 3 pairs of tests are running multithreaded, with always 2 tests running at the same time. The remaining 7 tests are executed singled threaded. The individual results for the 13 tests reveal to which extend different tasks are taking advantage of the bandwidth boost provided by the faster 1066 MHz system bus.

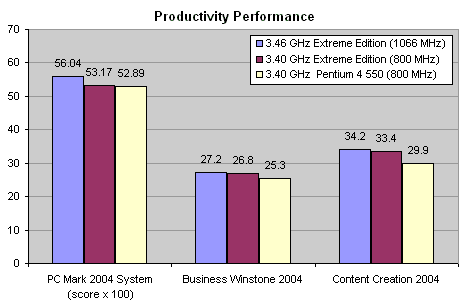
The overall system performance score shows a 4% difference between the two Extreme Editions and around 6% difference between the 3.46 GHz EE and the Prescott based 3.40 GHz. The individual tests show the 3.46 GHz EE leading the 3.40 GHz EE between 0% and 6% and the 3.40 GHz Prescott by up to 15%. The differences seem to be more random based, and it is not possible to identify a “pattern” between them.

Business Winstone and Content Creation Winstone are measuring overall system performance when working with business and content creation applications. They run batched scripts of mainstream productivity programs such as MS Office, Virus checking, Lotus Notes, Photoshop, Macromedia Director, Windows Media Encoder 9 and many others. Unfortunately they don’t show individual results for these applications; only a general score is given. Both benchmarks show a similar picture to PCMark 2004: The difference between the 3.46 GHz EE and the 3.40 GHz EE is a skimpy 3%. The 3.46 GHz EE however outruns the 3.40 GHz Prescott by around 10%.
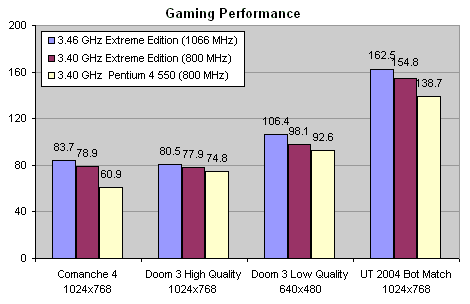
Evaluating the impact of system and CPU performance on games can be tricky. Frame rates in contemporary 3D games are mainly driven by the video subsystem. The higher the resolution and the more demanding the visual quality settings, the more the video card comes into play. In order to keep the video card as much as possible out of the equation, benchmarking with games is often done at the lowest possible resolution and visual quality. This way the impact of CPU and memory subsystem becomes more visible. The recently released OpenGL based Doom 3 is currently the hottest benchmark for gaming. The results with Doom 3 show exactly the tendency we described before: At a resolution of 640x480 with low quality we see a difference of almost 8% between the 3.46 GHz EE and the 3.40 GHz EE, but at 1024x768 the difference is only 4%. In both cases though the 3.46 GHz EE is delivering a healthy 15% more frames per second than a 3.40 GHz Prescott.

Unreal Tournament 2004 is the latest version of this popular DirectX 8 based game. We are using the freely configurable “bot match” which is regarded as UT 2004 best CPU benchmark. The 3.46 GHz EE is around 5% ahead of its 800 MHz EE sibling, and it outperforms the 3.40 GHz Pentium 550 by a hefty 20%. Novalogic’s Comanche 4 is an older DirectX 7 based game. It’s not any longer appealing as game, but the included benchmark makes a good CPU test because as a flight simulation it depends much more on the CPU processing power than most first-shooter games. In Comanche 4 we see the biggest difference between the 3 processors: At 1024x768 the 3.46 GHz EE delivers almost 35% more frames per second than the 3.40 GHz Prescott and still around 6% more than the 3.40 GHz EE.

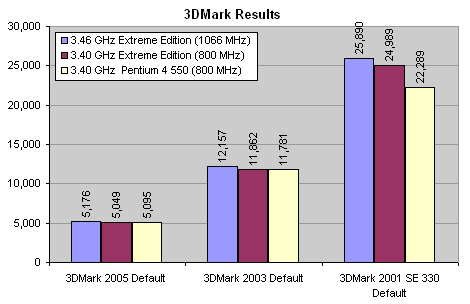
We see a similar situation in 3DMark 2001 and 3DMark 2005: The 2005 performance score is much more driven by the performance of the video subsystem than the 2001 score. In 3DMark 2001 the 3.46 GHz EE outruns the 3.40 GHz EE by 5% and is around 15% ahead of the 3.40 GHz Prescott. In 3DMark 2005 the difference between the 2 Extreme Editions is almost zero, and the difference between the 3.46 GHz EE and the 3.40 GHz Prescott just 2%.
Comparing the results of the productivity and gaming benchmarks we can see that games benefit more from the faster 1066 MHz system bus than productivity and general usage applications. We estimate the average difference that can be attributed to the faster 1066 MHz system bus at around 3% in productivity and general usage applications and around 6% in gaming.
|
|
Advertisement:
All original content copyright James Rolfe.
All rights reserved. No reproduction allowed without written permission.
Interested in advertising on OCAU? Contact us for info.
|

|


