|
|
|
|
|
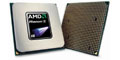
Scaling Down AMD's Phenom II 1090T |
|
Join the community - in the OCAU Forums!
|
Introduction, Setup, Game Benchmarks
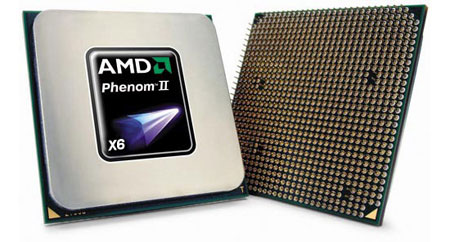
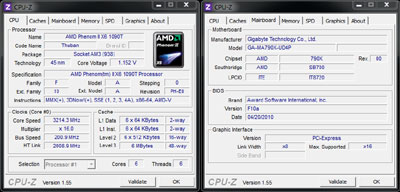
Six-core processors are the hot new items for enthusiasts, but what's the real benefit against the older quad and dual core brothers? This article looks at the latest six core Phenom II X6 1090T processor from AMD and how performance scales from six, four and two cores in a variety of games, benchmarks and applications commonly used today. The BIOS was used to disable CPU cores for this purpose.
With the release of AMD's first six core processors, AMD have implemented their own Turbo Boost variant called Turbo CORE which allows cores to be increased in frequency to up to 3.6GHz (this frequency varies per model). This is especially useful in applications that are single threaded or could just used as a boost on specific cores. An example of this frequency scaling can be found here.
While we welcome this feature and a more aggressive Cool 'n' Quiet implementation that allows idle or underutilised cores to reduce their frequency from 3.2GHz to a mere 800MHz in a blink of an eye. To allow more accurate and consistent results these features were disabled during testing.
Now moving on the to the benchmarking itself; traditionally the majority of CPU testing is done at the lowest resolution possible to reduce the chance of the graphics card hindering benchmarking of games. But as lower resolutions are becoming a thing of the past we feel that running tests at resolutions like 1280x1024 would be an a disservice to real world gaming - all tests will be run at 1920 x 1200 unless stated otherwise.
To make sure the CPU is doing as much work as possible, we have used two GIGABYTE Radeon HD5850s that are factory overclocked and in CrossFireX. We generally used lower-quality graphical settings in games to avoid bottlenecking the graphics cards, while the CPU is able to be used to its full capacity without the need to test using less-relevant lower resolutions.
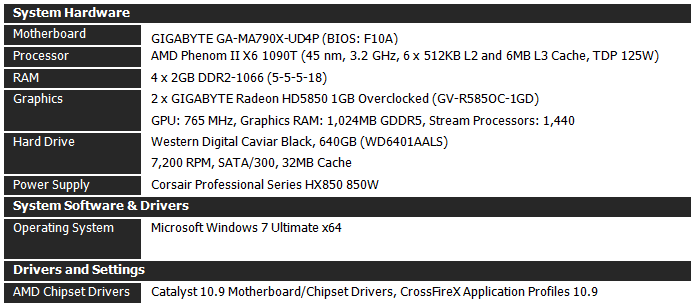
Today's test system consists of the hardware listed below, and as with all good testing a clean install is used and the latest Windows Updates and manufacturer drivers are applied. The applications and games used in today's tests are the latest of what was available at the time of this analysis - links to demo's and free trials are provided when applicable.
Gaming Benchmarks:
Right off the bat we start with our gaming results. Please note that all tests were done at 1920 x 1200 and while notes on some of the general settings are listed, the main focus is the FPS (frames per second) scaling with the use of six, four and two cores, rather than the performance of the graphics cards themselves. Many demos and benchmarks were used with default presets, or were adjusted to more appropriate settings if they were focused too heavily on the graphics themselves. Anti-Aliasing (AA) and Anisotropic filtering (AF) were avoided when possible.
Game: Colin McRae DIRT 2 (Retail)
Score: Average Frames per Second (FPS) - Higher is Better.
Demo Download Link: here.
Game: Resident Evil 5 (Benchmark)
Score: Average Frames per Second (FPS) - Higher is Better.
Download Link: here.
Game: STALKER: Call of Pripyat (Benchmark)
Score: Average Frames per Second (FPS) - Higher is Better.
Download Link: here.
Game: Lost Planet 2 (Benchmark)
Score: Average Frames per Second (FPS) - Higher is Better.
Download Link: here.
Game: Mafia II (Demo)
Score: Average Frames per Second (FPS) - Higher is Better.
Download Link: here.
Game: Tom Clancy's H.A.W.X (Demo)
Score: Average Frames per Second (FPS) - Higher is Better.
Download Link: here.
We can also check out the popular benchmark 3DMark Vantage:
Benchmark: 3DMark Vantage 1.0.2 (Advanced)
Score: CPU Points - Higher is Better.
Download Link: here.
|
|
Advertisement:
All original content copyright James Rolfe.
All rights reserved. No reproduction allowed without written permission.
Interested in advertising on OCAU? Contact us for info.
|
|