|
|
Advertisement:
|
|
Lynnfield i5 or i7 - This is the Question |
|
Join the community - in the OCAU Forums!
|
Vital Signs, Synthetic Test Results
VITAL SIGNS:
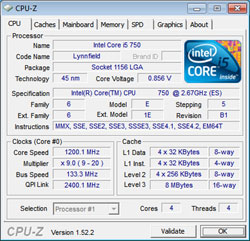
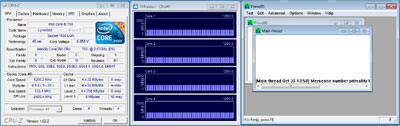
The i5 750 and i7 860 CPU-Z read-outs confirm the specifications: The 750 has as multiplier range of 9x to 20x, while the 860 has a range of 9x to 21x. With EIST enabled, both will idle at 9 x 133MHz = 1200MHz and the CPU voltage is lowered to around 0.80V. Thats steeper than EIST is dropping the 920 voltage and contributing to the overall lower power consumption when a Lynnfield system is idling.
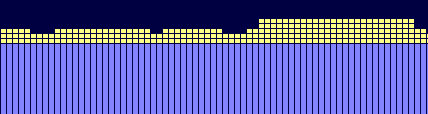
The author of the ubiquitous CPU-Z has just released another handy utility called TMonitor. It visualizes the effect of Turbo Boost as the processor is working. The turbo boosted frequency will appear as a yellow bar extension. The TMonitor graph shows as many yellow bricks as the number of "bins", namely the number of steps that the core multiplier is increased by the Turbo. If Turbo Boost is fully running, the 750 is therefore shown with 4 bricks, and the 860 with 5 bricks. TMonitor even allows switching off Turbo Boost without going into the BIOS.
The combination of EIST (Enhanced Intel Speed Stepping) and Turbo Boost gives the latest generation of Intel processors great flexibility in terms of voltage and frequency for handling different load scenarios. The following 3 screenshots are demonstrating how voltage and frequency are scaling up and down in line with processor load. The first screenshots shows the 750 in idle state. EIST is lowering the frequency down to 1.2GHz by dropping the multiplier to 9x and at the same time lowering the voltage to 0.85V to save energy.
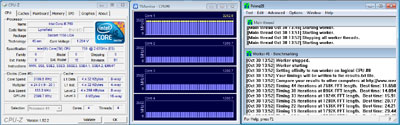
The second screenshot shows the 750 running under full load with 1 core only. In this case Turbo Boost lets the 750 run at 2.66@3.20GHz by scaling up the multiplier to 24x. We demonstrate this scenario with the help of the Prime95 Benchmark test. It allocates this test to one single core only. The CPU voltage goes up to 1.26V to provide better stability.
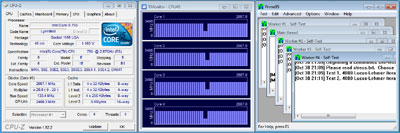
The 3rd scenario shows the Prime95 Torture test stressing all 4 cores simultaneously. In this case the 750 is running all cores at their default speed of 20x133MHz=2.66GHz.
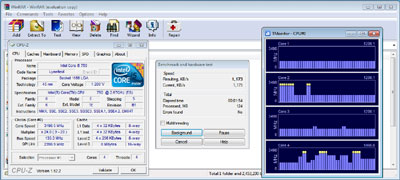
In order to show a real-world utilization pattern we have added a screenshot with WinRAR. It shows how the processor cores are utilized in a different pattern and how Turbo Boost kicks in.
SYNTHETIC TEST RESULTS:
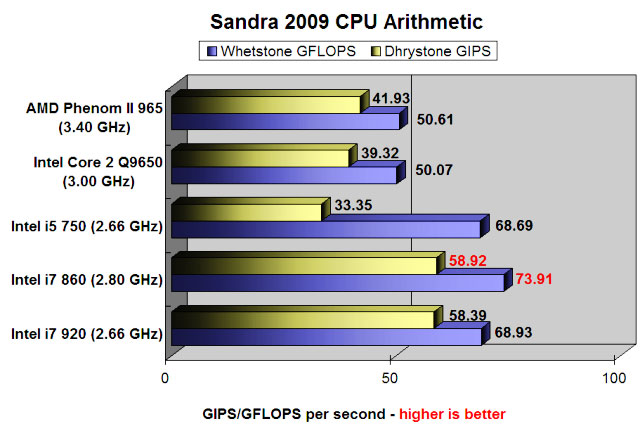
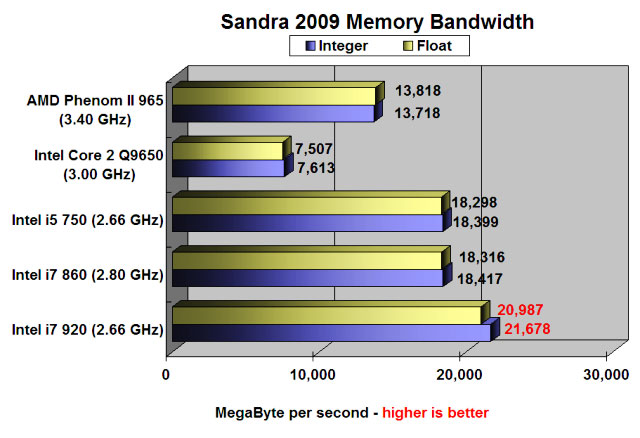
In all Sandra benchmarks the i7 860 system performs substantially better than the i5 750. This is because of the slightly higher base clock frequency, the more aggressive Turbo Boost and Hyperthreading. Thanks to the very fast QPI link and the on-die triple channel memory controller, the i7 920 system is providing huge memory bandwidth, untouchable for any other system. But even with the slower DMI bus and only a dual-channel controller the Lynnfield systems come close behind and are still well ahead of the Phenom 965 system. The Q9650 cannot compete here.
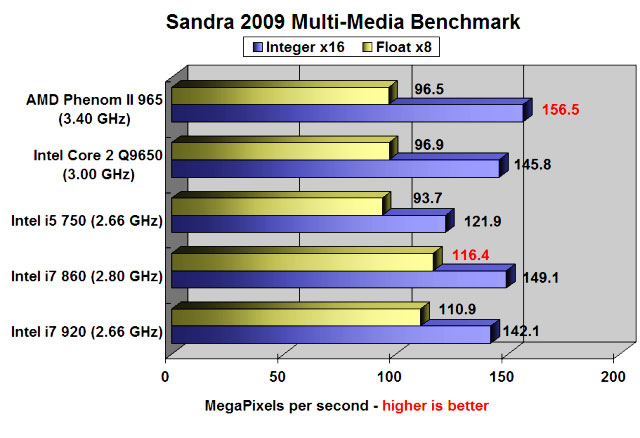
The Sandra Multimedia benchmark is testing CPU performance when handling multimedia instructions using MMX and SSE2/34. The 860 is again leading, while the 750 is surprisingly finishing both tests last.
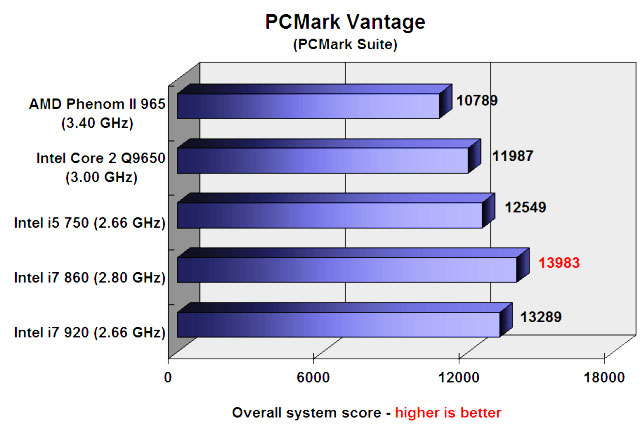
The PCMark Suite is a collection of various single- and multi-threaded CPU, graphics and HDD test sets designed to represent common everyday PC usage. The scores represent therefore platform performance and not like the Sandra benchmarks specific aspects of processor or subsystem performance. In a way, the PCMark Suite preempted, as we later found out, the results of the following application tests: The 860 performs best, followed by the 920 and the 750. Q9650 and Phenom 965 come in last, often with considerable distance. In this benchmark the 750 is trouncing the far higher clocked and more expensive Phenom II X4 965 by almost 15%.
|
|
Advertisement:
All original content copyright James Rolfe.
All rights reserved. No reproduction allowed without written permission.
Interested in advertising on OCAU? Contact us for info.
|
|