|
|
|
|
|
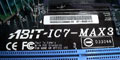
ABIT IC7-MAX3 i875P Motherboard |
|
Join the community - in the OCAU Forums!
|
Test Settings, Performance Results
TEST SETTINGS
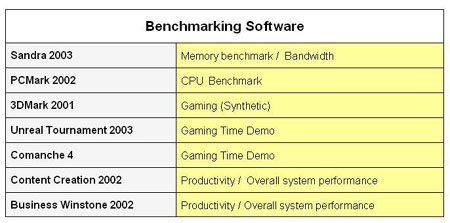
We used a 2600 MHz C version P4 CPU and two 512 MB A-DATA DDR 500 modules for our tests. We knew from previous tests that this CPU and these 2 memory modules have very high overclocking headroom. The best result achieved with this CPU was air-cooled around 3700 MHz on the ABIT IS7 and the memory was good for 273 MHz on the P4C800-E. All tests were done with the CPU to RAM ratio at 1:1 and the Radeon 9800 Pro running at default frequencies and driver settings. To test CPU, memory, gaming and productivity performance we used an array of well-known benchmarks including SANDRA 2003 and 3DMark 2001. Like most other test sites we did not use the newer (and more entertaining) 3DMark 2003. This benchmark is focused on measuring video card performance and not benching the gaming environment comprising video card AND system components as 3DMark 2001 is doing. It has therefore little value for mainboard testing.
For good measure we included the 875P chipset based ASUS P4C800-E as well as the 865PE chipset based ABIT IS7 and ASUS P4P800 mainboards in our tests. These 3 boards are regarded as the leading products in their categories and are therefore the main competitors for a high-end board like the Max 3. The comparison with these 3 high-end boards will show where the Max 3 stands in terms of performance. Our Max 3 test sample was not modified in any way. The only difference to a pure default set-up was the CPU cooling: Instead of the Intel stock HSF we used a Swiftech MC 4000 sink with a high performance 90 mm dual blade Delta fan. This is a very powerful cooling solution, good for very high overclocking results. During our tests the Max 3 was not installed in a PC case, which naturally has a positive impact on temperatures. Users who compare their results with the Max 3 with ours should keep this in mind.

PERFORMANCE RESULTS
As usual the first look goes to SiSoft SANDRA 2003 (download here) memory benchmark to get a rough idea how efficient the boards all-important memory to MCH communication is performing. SANDRA is returning buffered and unbuffered bandwidth. The unbuffered bandwidth is taken with SSE/MMX streaming optimizations disabled. The unbuffered bandwidth is the raw bandwidth. Many regard it as a better gauge than the buffered bandwidth that is calculating the streaming optimization impact and not actually measuring it. Our test results show the two 875P boards very slightly ahead of the two 865PE boards. The difference becomes a little bigger at 250 MHz, which is not surprising, assuming that Intel indeed is binning the chipsets and selling the better ones as 875P. It also seems that the ASUS P4C800-E is delivering slightly more bandwidth than the Max 3. In this regard it is however not appropriate to generalize our results. It is not possible to run the A-DATA DDR 500 modules we were using at the low latency settings required to take full advantage of the Max 3 Game Accelerator. At 200 MHz we could not even run Street Racer. And at 250 MHz not even the softest setting Turbo would work. The ASUS P4C800-E seems to work better with high latency memory, at least at default and moderately overclocked frequencies. With other words: Using low latency memory might have shown the Max 3 ahead or at least at the same level as the P4P800-C. We did not regret using DDR 500 memory though, because as we will later show above 270 MHz A-DATA DDR 500 memory is starting to shine on the Max 3.
The gaming and productivity benchmarks show that all boards are performing within a 3% margin. Such small differences are well within the usual fluctuation between test repetitions and therefore without relevance for real world usage. The two 875P boards are very slightly ahead of the two 865PE boards in basically all benchmarks. It also seems that the Max 3 is performing here and there a few frames per second better than the P4C800-E when gaming. It has become fashionable in test reports to magnify such miniscule differences by scaling the result charts in a way that only the last 10 % of a result bar is visible. All our charts are starting at 0 to put the results in the right perspective. This way its apparent at first glance that there is no difference of any importance between the 4 boards we tested. Increasing the CPU frequency from 2600 MHz to 3250 MHz is boosting gaming and productivity performance quite a lot on all 4 boards. With the exception of Business Winstone all benchmarks show gains from 15% to 25%. This is a substantial gain compared with the performance at default 2600 MHz, and it comes for free as the overclockers reward. This performance increase is not only the result of the higher clocked CPU. We had set the front-side-bus and memory frequency to run synchronously at 1:1. The memory was consequently running at 2 x 250 MHz = 500 MHz providing a much higher (and performance enhancing) memory bandwidth than running at 2 x 200 MHz = 400 MHz in 1:1. It seems that at 12 x 250 MHz = 3250 MHz the two 875P chipset based boards are very slightly enlarging their lead over the 865PE competition. But the differences remain within 5% and are therefore without relevance for actual usage. We can also see again that the Max 3 is performing a few frames per second better than the other boards when gaming.
|
|
Advertisement:
All original content copyright James Rolfe.
All rights reserved. No reproduction allowed without written permission.
Interested in advertising on OCAU? Contact us for info.
|
|